Radio-frequency Electromagnetic Microwave Radiation (RF-EMR) Measurements
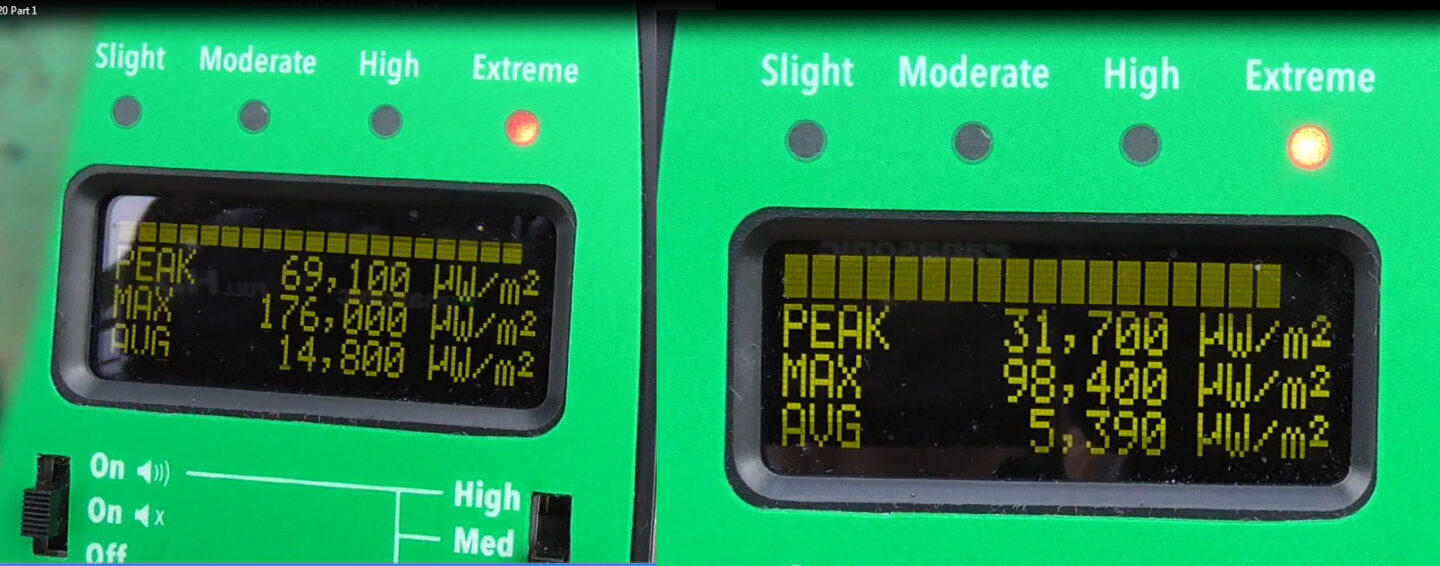
RF-EMR Measurements (from 400 MHz to 7,200 MHz) taken in Nov, 2020 at Port Authority and at 42nd St. at 9th Ave., using a Safe and Sound Pro II RF meter
Avg RF-EMR |
% FCC RF-EMR |
Max RF-EMR |
Higher |
Max × 10 |
Higher |
% FCC RF-EMR |
Max is x Higher Than |
|---|---|---|---|---|---|---|---|
| 14,800 | 0.15% | 176,000 | 12x | 1,760,000 | 120x | 17.6% | 88,000,000x |
| 5,390 | 0.05% | 98,400 | 18x | 984,000 | 180x | 9.8% | 49,200,000x |
Safe and Sound Pro II RF Meter Details (you can buy one here)
- PEAK = constantly varying best real-time measurement of RF-EMR peak — the meter usually measures the upslope or downslope of a peak, not the peak’s apex.
- MAX = the highest best peak RF-EMR measurement detected since meter was last reset.
- AVG = averages peak RF-EMR measurements with the micro-second periods when nothing is being transmitted, since the meter was last reset. Factoring in the zero time of such duty cycles reduces MAX measurements by a factor of 10 to 1,000 or more.
Each Safe and Sound Pro II RF Meter has been tested and certified by The Nemko Canada Inc. Testing Lab in Cambridge, Ontario.
Safe and Sound Pro II RF Meter Features:
- True response detection range: (400 MHz to 7.2 GHz) +/- 6dB
- Each meter is individually calibrated and QC inspected (see above), including Power Response linearization
- Meters are temperature compensated to measure accurately under any environmental conditions
- Measures power densities up to 2,500,000 µW/m² and down to 0.001 µW/m²
- Two Year Warranty
Safe and Sound Pro II RF Meter Technical Data:
| Frequency Range of Meter: | 400 MHz – 7.2 GHz |
|---|---|
| Accuracy | +/- 6dB – 3rd Party Certified (see above) |
| Frequency Measuring Range | 0.001 µW/m² to 2,500,000 µW/m² |
| Sampling Rate | 5 μs (a reading ever 5 millionths of a second) |
| Readings per second | 1 second / (5 / 1,000,000) second = 200,000 readings per second |
| LED Ranges @ 2.4 GHz | Green (Flash) → < 1 µW/m² Green → 1 – 10 µW/m² Yellow → 10 – 100 µW/m² Orange → 100 – 1000 µW/m² Red → 1000 – 10,000 µW/m² Red (Slow Flash) → 10,000 – 100,000 µW/m² Red (Fast Flash) → > 100,000 µW/m² |
Biologically-Based RF Microwave Radiation Exposure Guidelines
BioInitiative, 2020: “A scientific benchmark of 30 µW/m² for lowest observed effect level for RF microwave radiation is based on mobile phone base station-level studies. Applying a ten-fold reduction to compensate for the lack of long-term exposure (to provide a safety buffer for chronic exposure) or for children as a sensitive subpopulation yields a 3 to 6 µW/m² RF Microwave Radiation exposure guideline”
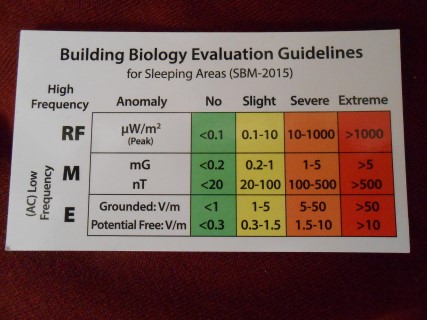
Similar scientifically-based RF Microwave Radiation Exposure Guidelines are published by the International Institute for Building-Biology & Ecology:
| No Hazard | Slight Hazard | Severe Hazard | Extreme Hazard |
|---|---|---|---|
| < 0.1 µW/m² | 0.1 µW/m² to 10 µW/m² | 10 µW/m² to 1,000 µW/m² | > 1,000 µW/m² |
- µW/m² = millionths of a Watt per square meter (a measurement of power flux density)
- Power flux density (PFD) = the amount of electromagnetic power that flows through a unit area: expressed as microWatts (µW) per square meter (m²).
- PFD measures only the rate of electromagnetic power, NOT the total electromagnetic power delivered over time, which requires the rate to be multiplied by the time of exposure and then requires reporting the results in a more relevant unit: µW-seconds/m² or µJoules/m²
- Average µW/m² readings, as specified by the FCC, significantly under-report the levels of pulsed, data-modulated, RF microwave radiation exposures for two reasons —
- Peak RF microwave radiation exposures meter 100x–1000x higher than average RF microwave radiation for data-carrying, modulated, high-crest signals like Wi-Fi, 4G/LTE and 5G because of the duty cycle, inherent in these RF signals. Inexplicably, the FCC RF microwave radiation exposure guidelines only consider average RF microwave radiation exposures, which is a significant error because living organisms’ biology reacts to the sharp changes of RF microwave radiation from zero to peak levels and back again. This is more fully explained here: Palo Alto Whitewashes RF Microwave Radiation Exposure Hazards
- The FCC RF microwave radiation exposure guidelines consider neither the time of exposure nor the total electromagnetic power delivered over time, which is utter nonsense and scientifically unsound. This is more fully explained here: RF Microwave Radiation Counter.